


Introduction
We attempted to evaluate Florida’s and Tampa Bay metropolitan area’s population growth since the first such data became available, how Tampa Bay population’s growth correlates with Florida’s population growth, and how Florida and Tampa Bay stacks against general US population growth trends.
In order to do it, we started by collecting available census data, creating plots, analyzing them, and then generating meaningful insights into the data.
The first census data for Florida is available from the 1830 census. This was the first census that was conducted after Florida became a US territory in 1821. The 1830 census data shows that Florida had a population of 34,730 people.
The first US population census was done in 1790, as mandated by Article 1, Section 2, of the Constitution. The census was conducted by marshals of the US judicial districts, and it counted the population of the United States as of August 2, 1790. The census found that the United States had a population of 3,929,214 people.
The first census data for the Tampa Bay, FL metropolitan area is available from the 1950 census. This was the first census that was conducted after the US Census Bureau began defining metropolitan areas. The 1950 census data shows that the Tampa Bay metropolitan area had a population of 528,542 people.
The Tampa Bay metropolitan area is defined by the US Census Bureau as including Hillsborough and Pinellas counties. The metropolitan area is centered on the city of Tampa, but it also includes a number of other cities and towns, such as St. Petersburg, Clearwater, and Lakeland.
However, with the help of Google’s Bard, we were able to access data for Tampa Bay area from 1900.
Data Sources
All data came from reliable sources, such as US Census Bureau, National Archives, and Wikipedia.
Technologies Used
We used Google AI tool, Bard, to collect the data, and checked the sources to make sure they were trustworthy. Then we asked ChatGPT-4, using its Advanced Data Analysis tool, to analyze the data, make plots, and create insights into the collected data.
Purpose
This, by no means, is an AI-generated content. AI tools were employed to gather and analyze data, and to create insights which would be very difficult, if not impossible, to accomplish without the use of AI.
It is, more so than a simple look at statistical data of population growth rates, a try to utilize artificial intelligence tools to see their usefulness in research, data collection, data visualization, and insights generation. In the process, we gathered a lot of statistical information, as well as created some interesting plots and generated pretty useful insights into the US, Florida and Tampa Bay area’s population growth rates.
Conclusion
ChatGPT-4, together with its search with Bing feature, is no match to Google’s Bard for research. Bard delivered relevant and accurate results quickly and effortlessly, providing credible sources when asked. GPT, on the other hand, not only seemed to labor extremely hard with simple data collection, but also, in many cases, could not find relevant data, whereas Google’s Bard was dancing like Roger Federer on a tennis court. Therefore, for serious research Bard is a clear AI-to-go.
When it comes to creating plots and data analysis, we used ChatGPT for a simple reason: Bard doesn’t seem to want to be fed documents. After trying different approaches, we gave up, because even when directions on how to upload files with data to Bard came from Bard itself, they simply did not work. Not through Google Drive, not in any other way.
GPT-4, on the other hand, did a pretty good job with providing insights into data, drawing conclusions, reasoning, and brought up some interesting observations in the process. Working with plots was a double-edged sword: on one hand, it’s addictive to be able to get any plot you want in seconds, or even get ideas on what/how to visualize. On the other hand, at times it proved to be a pretty frustrating process, as GPT struggled with the simplest adjustments and commands.
A major concern with AI is information trustworthiness (aka, avoiding AI “hallucinations”, or incorrect statements and information). It is extremely important to make sure that a) the data are credible, and b) AI’s data interpretation, visualization and reasoning is not only drawn from the data it is provided, but also is accurate. Bard did a great job with pure data extraction; however, ChatGPT had to be constantly checked and corrected for errors to avoid Aristotelian logic which, although in essence was the right way for reasoning, led to “hallucinations” which distorted the way of thinking and science for millennia simply because incorrect set of initial assumptions were used.
All in all, we found a combination of Bard and ChatGPT, when used with caution and their limitations in mind, are extremely useful tools for research, data analysis, and generation of meaningful original insights.
Outline
1 – US Population
2 – Florida Population
3 – Tampa Bay Population
4 – US vs. Florida vs. Tampa Bay Population
US Population
Let’s start by examining US population from 1830 to 2023. We asked Google’s Bard to gather the data from credible sources, and then fed the data to GPT-4 Advanced Data Analysis tool. As a result, we came up with the following plot showing US population change rate over the years, as well as key insights from the data.
| Year | Population | Population Change | Population Change % |
| 1830 | 12,866,020 | - | - |
| 1840 | 17,069,453 | 4,203,433 | 32.60% |
| 1850 | 23,191,876 | 6,122,423 | 35.90% |
| 1860 | 31,443,321 | 8,251,445 | 35.60% |
| 1870 | 38,558,371 | 7,115,050 | 22.60% |
| 1880 | 50,155,783 | 11,597,412 | 30.10% |
| 1890 | 62,979,766 | 12,823,983 | 25.50% |
| 1900 | 76,212,168 | 13,232,402 | 21.00% |
| 1910 | 92,228,496 | 16,016,328 | 20.90% |
| 1920 | 106,021,537 | 13,793,041 | 14.90% |
| 1930 | 123,202,624 | 17,181,087 | 16.20% |
| 1940 | 132,164,569 | 8,961,945 | 7.30% |
| 1950 | 151,325,798 | 19,161,229 | 14.50% |
| 1960 | 179,323,175 | 28,017,377 | 18.50% |
| 1970 | 203,302,031 | 23,978,856 | 13.40% |
| 1980 | 226,504,825 | 23,202,794 | 11.40% |
| 1990 | 248,709,873 | 22,205,048 | 9.80% |
| 2000 | 281,421,906 | 32,712,033 | 13.10% |
| 2010 | 308,745,538 | 27,323,632 | 9.70% |
| 2020 | 331,437,513 | 22,691,975 | 7.40% |
| 2023 | 334,382,513 | 2,945,000 | 0.90% |
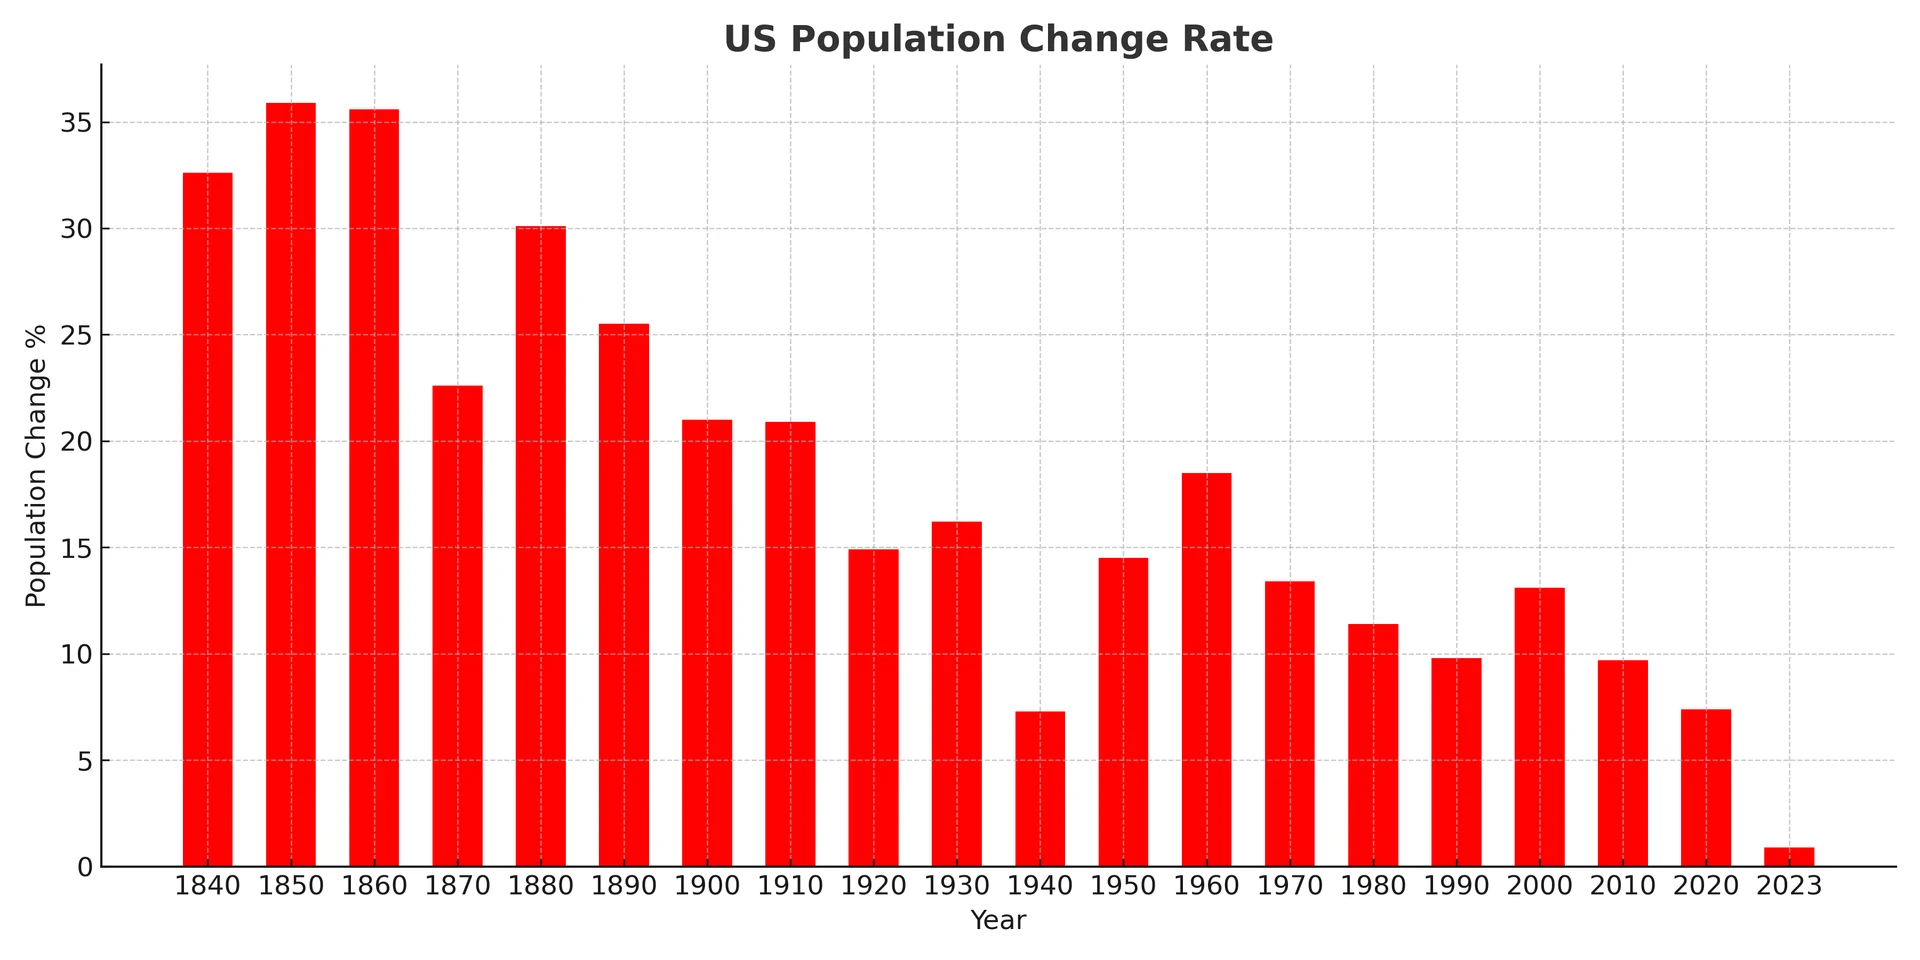
GPT-4 Generated Key Insights:
Early Rapid Growth: The US experienced rapid population growth in the 19th century, particularly from the 1830s to the 1850s.
Civil War Impact: There’s a noticeable decline in the population growth rate around the 1860s, likely due to the impact of the Civil War (1861-1865).
Stable Growth in Early 20th Century: The early part of the 20th century, especially from the 1900s to the 1930s, saw relatively stable growth, with some fluctuations.
Great Depression Impact: There’s a dip in the population growth rate in the 1930s, potentially reflecting the impact of the Great Depression.
Post-WWII Baby Boom: A significant spike in the population growth rate is observed after World War II, in the late 1940s and 1950s, commonly referred to as the “Baby Boom”.
Declining Growth in Late 20th Century: From the 1960s onwards, there’s a general trend of declining population growth rates, which continues into the late 20th century.
21st Century Stability: The early 21st century, particularly the 2000s, sees a relatively stable, albeit low, population growth rate compared to historical rates.
Recent Decades: The most recent data points, from the 2010s and onwards, indicate a further decline in the population growth rate, suggesting that the US is experiencing slower population growth.
Absence of Negative Growth: Despite fluctuations in the growth rate, the US has not experienced a negative population growth rate in the time frame provided by the data.
Overall Population Increase: Over the span of the data from 1830 to 2023, the US has seen a continuous increase in its population, reflecting various historical, economic, and social factors that have shaped the nation.
Florida Population
Let’s examine Florida’s population now.
| Year | Population | Population Change | Population Change % |
| 1830 | 34,313 | - | - |
| 1840 | 54,477 | 20,164 | 58.70% |
| 1850 | 87,445 | 32,968 | 60.50% |
| 1860 | 140,424 | 52,979 | 60.50% |
| 1870 | 187,748 | 47,324 | 33.80% |
| 1880 | 269,493 | 81,745 | 43.50% |
| 1890 | 391,422 | 121,929 | 45.20% |
| 1900 | 528,542 | 137,120 | 35.00% |
| 1910 | 752,619 | 224,077 | 42.40% |
| 1920 | 968,479 | 215,860 | 28.70% |
| 1930 | 1,468,211 | 499,732 | 51.90% |
| 1940 | 1,897,414 | 429,203 | 29.30% |
| 1950 | 2,771,305 | 873,891 | 45.50% |
| 1960 | 4,951,560 | 2,180,255 | 78.70% |
| 1970 | 6,789,447 | 1,837,887 | 37.10% |
| 1980 | 9,746,324 | 2,956,877 | 43.50% |
| 1990 | 12,937,926 | 3,191,602 | 32.80% |
| 2000 | 15,982,824 | 3,044,898 | 23.60% |
| 2010 | 18,846,143 | 2,863,319 | 17.90% |
| 2020 | 21,589,602 | 2,743,459 | 14.60% |
| 2023 | 22,661,582 | 1,071,980 | 4.90% |
GPT-4 generated plot representing FL population change rate from 1830 to 2023:
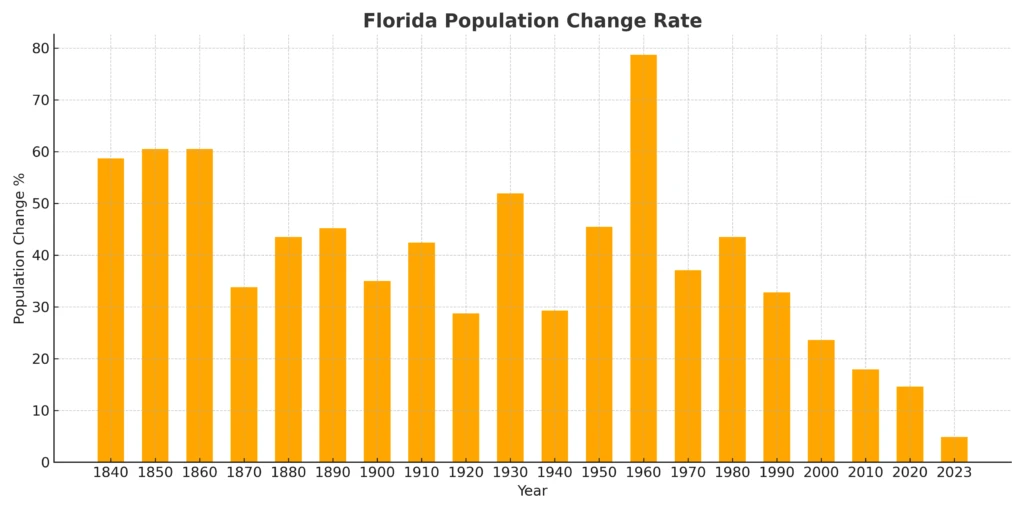
GPT-4 Insights
Early Steady Growth: From the 1830s to the late 1800s, Florida saw a steady increase in its population growth rate.
20th Century Boom: The early to mid-20th century, especially from the 1920s to the 1970s, witnessed rapid spikes in the population growth rate. This could be attributed to factors like industrialization, development of infrastructure, and migration trends.
Great Depression Impact: Similar to the national trend, there’s a dip in the population growth rate during the 1930s, likely due to the Great Depression’s economic impacts.
Post-WWII Surge: The period after World War II, particularly the 1950s and 1960s, saw a significant surge in Florida’s population growth. This might be related to the broader national trend of the “Baby Boom” and the appeal of Florida as a destination.
Late 20th Century Fluctuations: The latter half of the 20th century experienced fluctuations in the growth rate, with noticeable peaks and troughs.
21st Century Decline: The early 21st century, especially the 2000s and 2010s, saw a decline in the population growth rate, though it remained positive.
Recent Stability: The most recent data from the 2020s suggests a stable, albeit lower, growth rate compared to historical highs.
Consistent Positive Growth: Throughout the data, Florida has consistently experienced positive population growth, reflecting its appeal as a residential and economic destination.
Comparatively High Growth: Compared to the national average, Florida often exhibits a higher population growth rate, highlighting its unique position as a growth hub.
Various Driving Factors: Florida’s population trends have likely been influenced by a combination of factors, including climate appeal, economic opportunities, tourism, and retirement appeal, among others.
Tampa Bay Population
Let’s take a closer look at Tampa Bay metropolitan area’s population change over years. Data for Tampa Bay was available only from 1900:
| Year | Population | Population Change | Population Change % |
| 1900 | 120,792 | - | - |
| 1910 | 165,370 | 44,578 | 36.90% |
| 1920 | 186,597 | 21,227 | 12.84% |
| 1930 | 292,233 | 105,636 | 56.61% |
| 1940 | 357,792 | 65,559 | 22.43% |
| 1950 | 468,094 | 110,302 | 30.83% |
| 1960 | 977,932 | 509,838 | 108.92% |
| 1970 | 1,243,175 | 265,243 | 27.12% |
| 1980 | 1,641,301 | 398,126 | 32.02% |
| 1990 | 2,184,890 | 543,589 | 33.12% |
| 2000 | 2,587,089 | 402,199 | 18.41% |
| 2010 | 2,782,620 | 195,531 | 7.56% |
| 2020 | 3,175,275 | 392,655 | 14.11% |
| 2023 | 3,231,844 | 56,569 | 1.78% |
Plot representing Tampa Bay population’s change rate from 1900 to 2023:
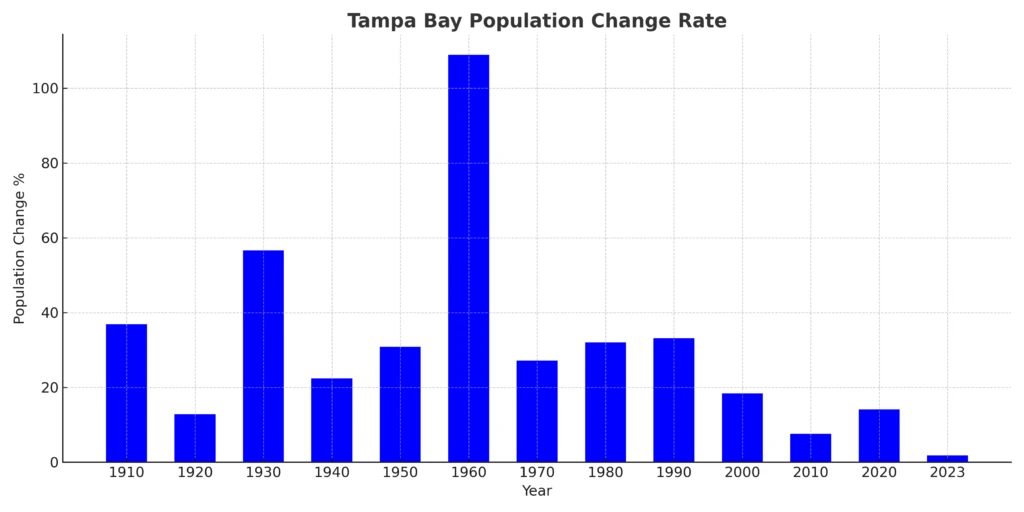
GPT-4 Insights
Early 20th Century Growth: The early part of the 20th century, especially from the 1900s to the 1930s, saw rapid growth in Tampa Bay’s population.
Great Depression Impact: The 1930s exhibit a decline in population growth rate, likely reflecting the economic impacts of the Great Depression.
Post-WWII Surge: The period after World War II, particularly the 1950s, witnessed a significant surge in Tampa Bay’s population growth.
Late 20th Century Stability: From the 1960s to the 1980s, Tampa Bay experienced relatively stable population growth, with minor fluctuations.
21st Century Growth: The early 21st century, especially the 2000s, saw an increase in the population growth rate, suggesting a renewed attraction to the region.
Recent Decades: The 2010s and 2020s data indicate a decline in the growth rate, although the rate remains positive.
Consistent Positive Growth: Throughout the dataset, Tampa Bay has consistently experienced positive population growth, showcasing its appeal as a residential and economic region.
Economic and Social Factors: Tampa Bay’s growth trends might be influenced by a combination of factors, including economic opportunities, infrastructure development, and cultural attractions.
Tourism Impact: As a major tourist destination, tourism likely plays a role in influencing population trends and migration patterns to Tampa Bay.
Comparatively High Growth: Compared to national averages, Tampa Bay often exhibits higher population growth rates, emphasizing its position as a growth hub in Florida.
USA vs. Florida vs. Tampa Bay
First, let’s look at how the population growth rates stack against each other:
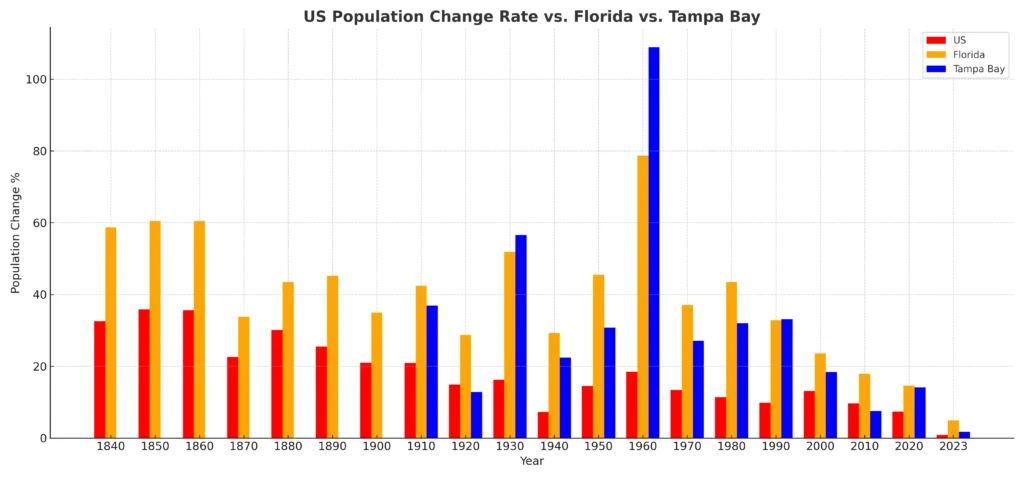
GPT-4 Insights
Early Growth (1840-1900): In the early years (around the mid-1800s to the turn of the 20th century), while the US showed consistent growth, Florida and Tampa Bay had more variable rates. This suggests that while the nation as a whole was growing steadily, Florida and Tampa Bay experienced periods of rapid expansion followed by slower growth or even decline.
Florida’s Surge (1900s): Starting from the early 1900s, Florida began to see a notable increase in its population change rate, often surpassing the national average. This could be due to factors like improved transportation, the appeal of its climate, or economic opportunities.
Tampa Bay’s Growth Mirrors Florida: Throughout the timeline, Tampa Bay’s growth rate often mirrors Florida’s, suggesting that the factors influencing Florida’s growth also played a significant role in Tampa Bay.
Post-WWII Boom: After World War II (around the 1950s), all three regions witnessed a surge in population growth. The US experienced the post-war baby boom, while Florida and Tampa Bay likely benefited from a combination of this national trend and increased migration due to factors like the appeal of the Sunbelt and economic opportunities.
Late 20th Century Slowdown: Towards the end of the 20th century, while the US saw a gradual decrease in its population change rate, both Florida and Tampa Bay experienced sharper declines in growth. This could be due to saturation, economic shifts, or changes in migration patterns.
21st Century Resurgence: In the early 21st century, all three regions saw a resurgence in growth. Florida and Tampa Bay, in particular, seemed to bounce back more robustly, indicating a renewed interest in the region.
Tampa Bay’s Volatility: Tampa Bay’s population change rate appears more volatile than both the US and Florida. It has periods of sharp growth followed by slowdowns, indicating that it might be more sensitive to local economic, environmental, or social factors.
Recent Trends (Post-2010): In the most recent years, while the US has seen a steady decline in its population change rate, both Florida and Tampa Bay have maintained higher growth rates, suggesting that they continue to be attractive destinations for migration and growth.
Tampa Bay Outpaces Florida: There are periods, especially in recent years, where Tampa Bay’s growth rate surpasses Florida’s average. This suggests that within Florida, Tampa Bay might be a particularly appealing or economically vibrant region.
Overall: While the US provides a backdrop of broader national trends, Florida often amplifies these trends, either growing faster during boom periods or slowing down more during downturns. Tampa Bay, as a city within Florida, showcases even more pronounced reactions, reflecting both the state’s overall tendencies and its unique local dynamics.
Florida Population’s Rank Among the States